3.2.1 Generating Graph Reports of Position Indicated
-
In the viewer Panel, Click the third tagged Label called “Reports”

-
Click the button called Graph Reports of Position Indicators.
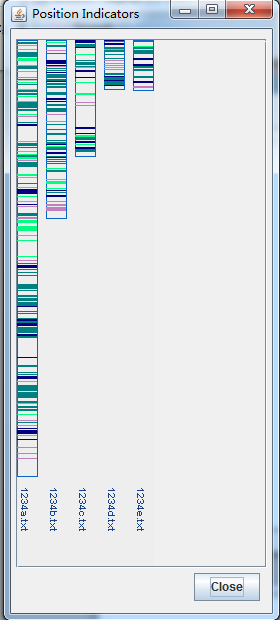
For the output graph, it indicates the annotations’ position by each of the file and the length of each annotation. It will also show with multiply files. The height of each box means the length of each file. Each colored line indicated the position and the spam of the annotations in that file.
The generated graphs are opened through eHOST’s built-in web server. To reopen them later, or to open a report folder from another location, see 3.7 Viewing and Sharing Reports.